|
 |
|
 |
Costing and break-even
analysis
Costing is...
Working out an organization’s costs which are:
1. Fixed costs These don’t change in the short-term, if sales or production changes e.g. rent, property taxes and management salaries.
2. Variable costs These increase (decrease), if sales or production increases (decreases) e.g. overtime and a salesperson’s commission.
Costs can also be defined as:
1. Direct costs Directly related to producing an organization’s product - for example
2. Indirect costs These can’t be directly related to production e.g. administrative expenses. They are also called overhead costs (or simply overheads).
Activity-based costing (ABC)... Calculates the costs of the activities (or processes) required to produce and sell the organization’s product(s) like:
Costing is vital for...
(to minimize cost and so maximize efficiency).
2. Calculating profit (see below)
3. Calculating prices (e.g. cost-plus pricing – see pricing).
4. Valuation of an organization’s assets This is normally based upon their historical cost (or purchase price), which can be misleading in times of high inflation. So current cost accounting values assets according to their replacement cost.
Calculating profit
A business’s net profit is: Sales revenue (selling price x units sold/produced) less Total costs (fixed costs + variable costs i.e. variable costs per unit x units sold/produced).
In our examples we assume that a business sells what it produces.
Break-even analysis This calculates the break-even point that can be calculated in two ways:
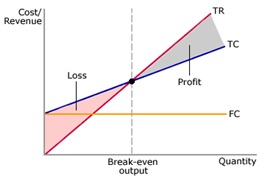
Break-even point (in units produced or sold) = Fixed costs Selling price ($) less variable costs per unit ($) 2. By drawing a graph(called abreak-even chart) Like this: Where: TR (total revenue) = Price x units sold TC (total costs) = Fixed costs (FC) + Variable costs. TR = TC is the break-even point TR - TC = Profit TC -TR = Loss
Break-even analysis – an example (a toy car maker)
Assume: 1. Fixed costs are $10,000. 2. Selling price of each car is $2. 3. Variable costs per unit (i.e. per car produced/sold) are 1$. 4. The toy maker sells all the cars it produces. By the formula the toy maker’s break-even point is: 10,000 = 10,000 cars 2-1 To draw the break-even chart, calculate the profit/loss at different levels of production/sales up to 15,000 units:
You then draw the break-even chart to look like the chart above.
Why break-even analysis is important
1. Break-even point This shows how many units have to be sold before you start to make a profit (vital in deciding whether or not to invest in new products, factories, equipment, etc.). The break-even chart indicates possible ways of reducing the break-even point:
2. Contribution This is sales revenue less variable costs – in our example contribution is $10,000 at 10,000 units. Contribution is useful because it indicates how much money is being earned to pay for fixed costs. If contribution is positive (i.e. sales revenue is greater than variable costs), a business should continue to produce in the short-term even if it is making a loss (when total costs are greater than sales revenue). The reason is that continuing to produce will help to pay off fixed costs.
Key quotes explained
“There is no such thing as a free lunch”, - Milton Friedman, American economist (pictured right). This phrase (originating from American bars offering free lunches with drinks in the 1930’s) illustrates the economist’s concept of opportunity cost that values something in terms of the benefits lost (or foregone) to get it. For example, the cost of a ‘free lunch’ is the benefits lost from the meal provider spending the money on the next best alternative. Another cost used by economists is marginal cost, the increase in costs from increasing production by one unit.
“Would any of you think of building a tower without first sitting down and calculating the cost, to see whether he could afford to finish it?”, - Jesus (to his disciples in Luke 14,28) Costs are wasted, if you can’t afford to complete the job.
“A thing is worth what it can do for you, not what you choose to pay for it”, - John Ruskin, English writer and artist (pictured right). An organization should only spend money on things that help to achieve its objectives like customer satisfaction. | ||||||||||||||||||||
|
|
||
|
|
|
||
|
||
| Copyright © wisdomtowin.com All Rights Reserved | ||
|


